


Forecasting & Valuation
Effective forecasting requires an in-depth understanding of financial
modeling and the ability to collect and tie together multiple data
sources. Our experience as consultants, combined with our extensive
work in primary and secondary research, makes us well equipped for
the challenges of forecasting.
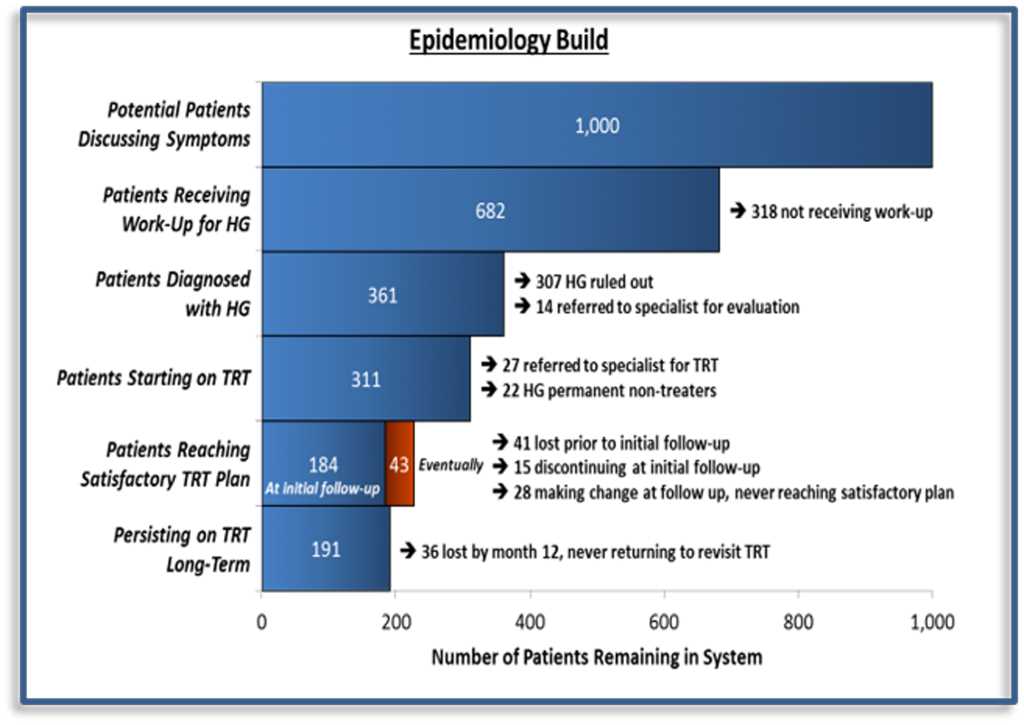
We begin our forecast projects by determining the data needed to
size the market and constructing the corresponding epidemiology
estimates – the foundation of a forecast model. We utilize
available secondary data and identify additional data points to
be captured through primary research, such as treatment rates
or patient persistence. Integrating the primary and secondary
data allows for a more complete and accurate view of the
potential market for a product.
Example: Components of an Epidemiology Estimate
We also create an influence diagram to model how different stakeholders
interact and impact the target product’s sales. The diagram highlights
decisions and interactions that should be quantified through primary
research where possible.
Developing the epidemiology estimates and influence diagrams at the
start of the project, allows us to create efficient and targeted
research tools.
Example: Generalized Influenced Diagram for a Pharmaceutical Product
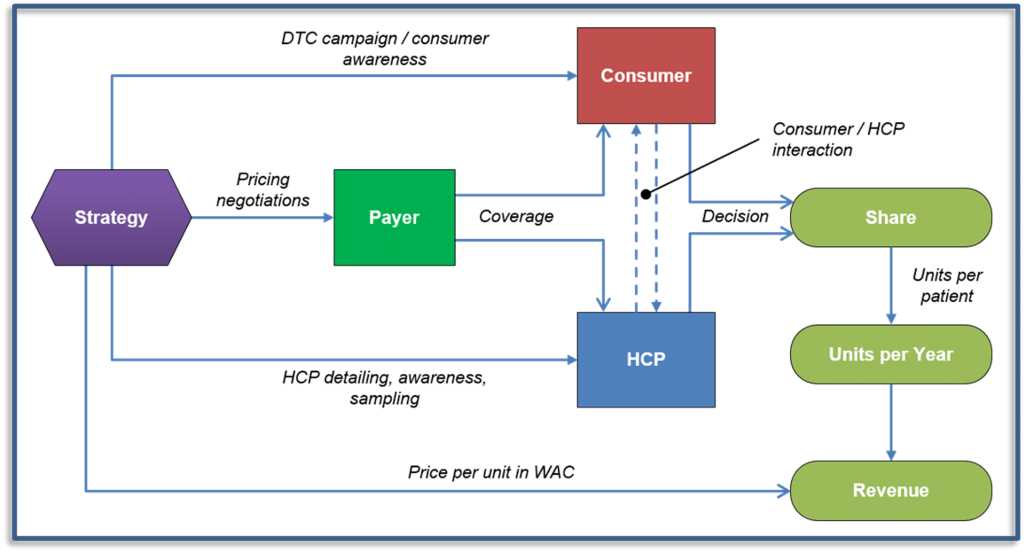
We look to use data from multiple sources or audiences to
effectively model the complex series of interactions and
influences that drive a product’s market share. We account for
various factors such as price sensitivity, potential prior
authorization constraints, and patients’ willingness to follow a
physician recommendation.
Next, we create the forecast model itself in Excel, often in
parallel with the fielding of primary research. The influence
diagram guides the structure of the forecast model and
establishes the various inputs and uncertainties the model must
accommodate.
Our forecast models are transparent and highly flexible so they
can be readily revised as information and assumptions change.
All of our forecast models are delivered in a user-friendly
Excel format with inputs and assumptions that can be varied buy
the user, allowing anyone to see the financial impact of
different assumptions or decisions.
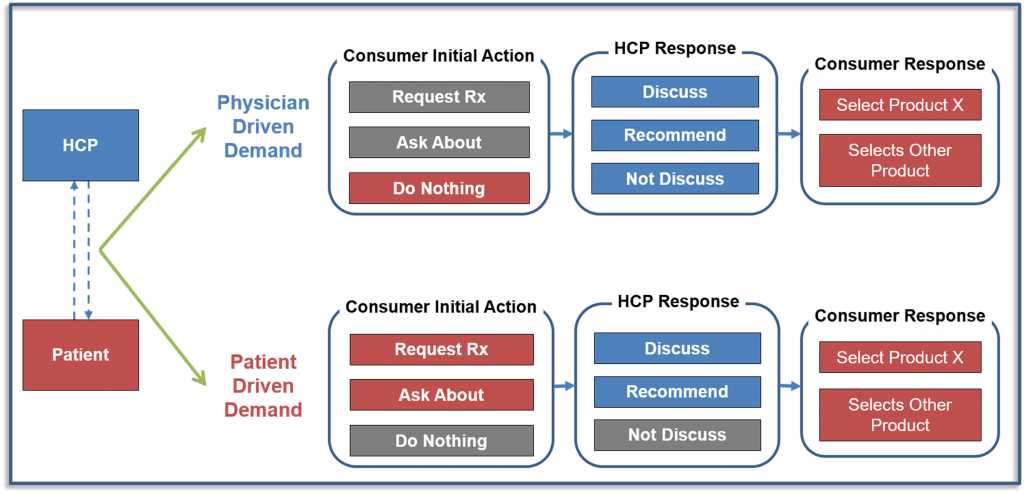
Example: Modeling Patient – Physician Interactions to Predict Market Share
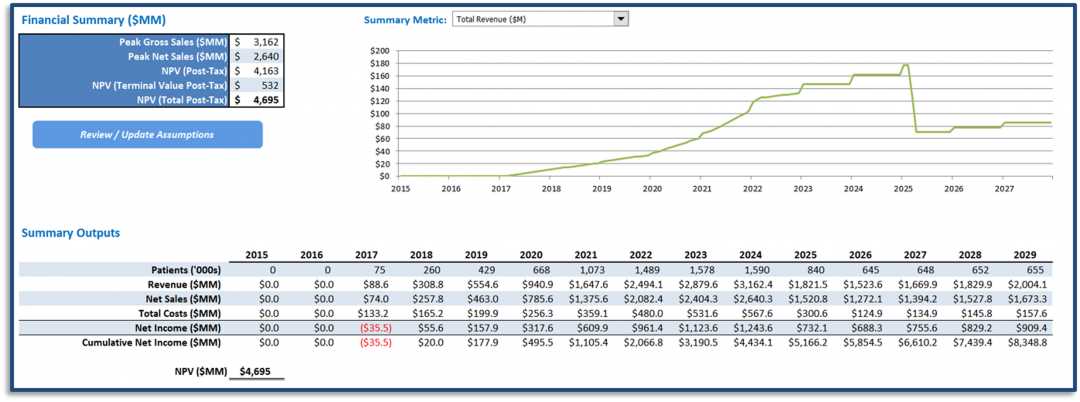
Our forecast models often incorporate key market events, such as
the entrance of new competitors, loss of exclusivity of existing
competitors, or additional indication, and utilize primary
research or secondary data proxies to project the impact on that
target product. We often also incorporate our client’s potential
market entry strategies, allowing them to play out different
strategies in different scenarios to understand when the
strategies would be most effective.
Example: Typical Forecast Model Output
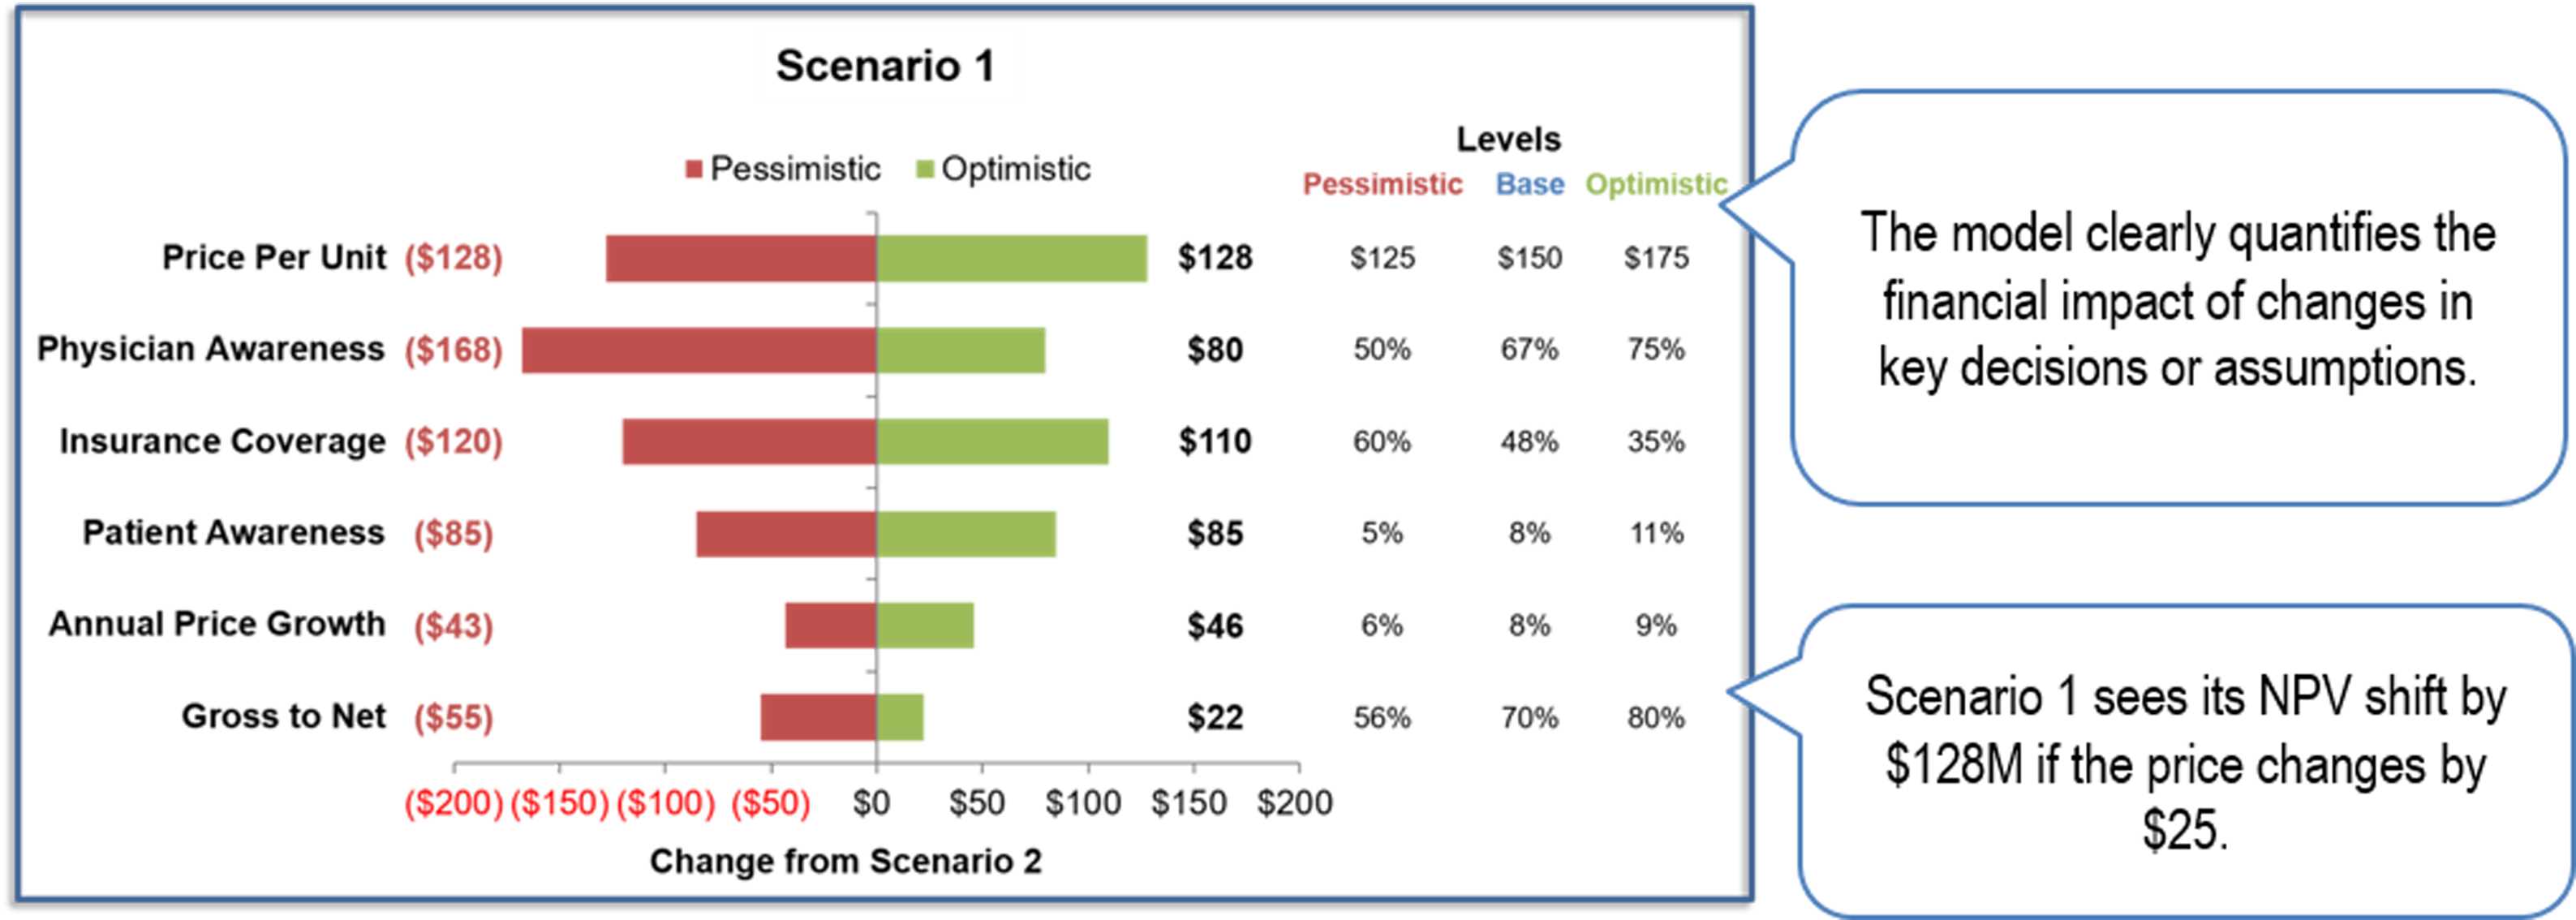
As part of our forecasting process, we conduct sensitivity and
risk analysis to understand how different assumptions or
decisions impact the overall financial performance. The analysis
highlights potential sources of risk as well as areas that may
warrant further research.
Example: NPV Sensitivity to Key Assumptions
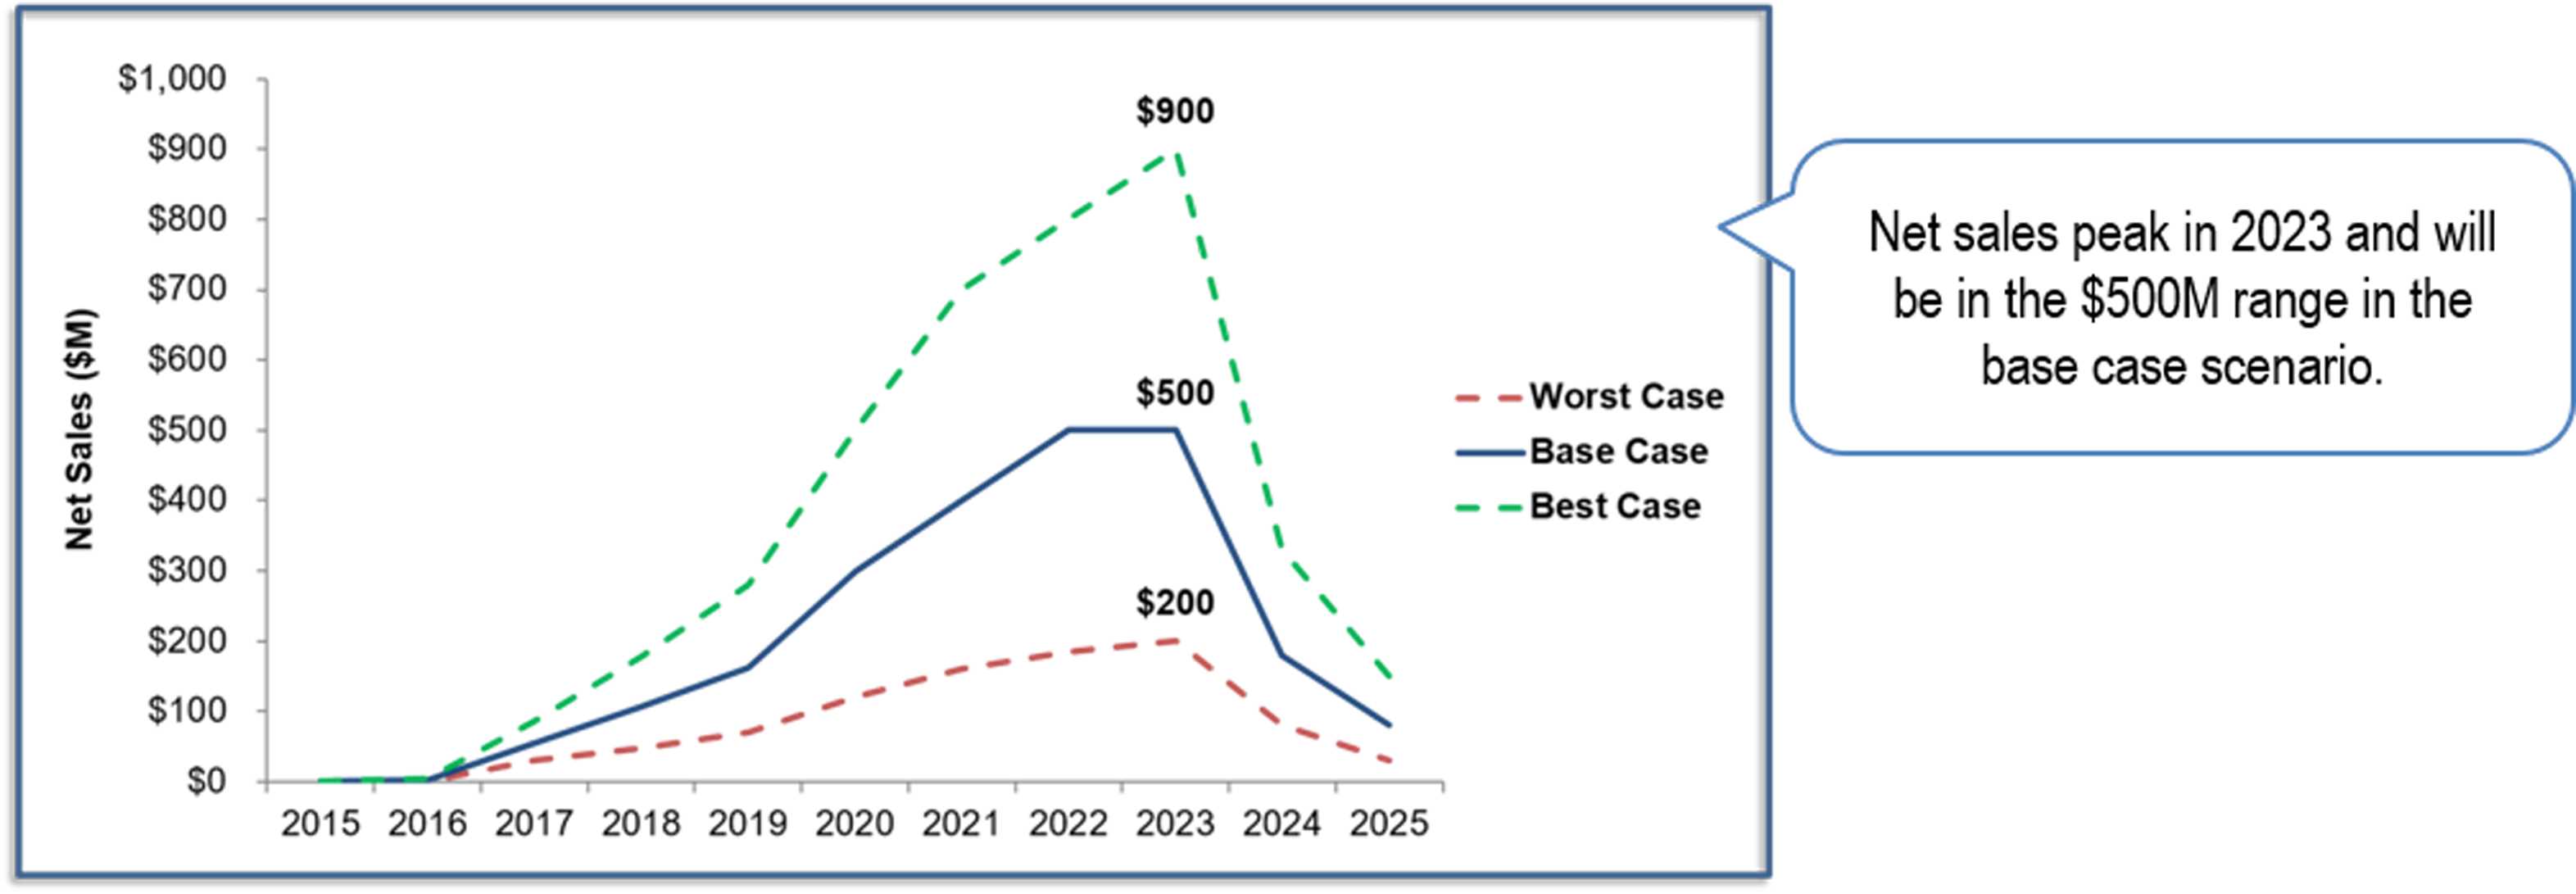
Example: Net Sales Projections by Scenasrio
The combination of outputs and analyses, along with the team’s
ability to modify the forecast model to incorporate new or
changing data, enables us to make strategic recommendations and
equips our clients to make informed, financially sound
decisions.